MARITIME DATA:
Leveraging data to optimize vessel performance
Faced with increasing regulatory pressures, rising fuel costs, and decarbonization imperatives, maritime professionals no longer have the luxury of improvising. Maritime data is now emerging as THE central lever for more controlled, leaner, and more efficient fleet management.
Collecting the right data, analyzing it in real time, and transforming it into concrete operational decisions: this is precisely what the Ecomer Data analytical econometer enables. A solution designed for the maritime industry, by maritime experts.

What is maritime data?
Maritime data refers to all digital data collected, transmitted, and utilized within the framework of vessel operations and/or fleet management. It covers a wide range of information: energy consumption data, engine parameters, speed, GPS position, environmental conditions, as well as operational performance or regulatory compliance indicators.
Long confined to manual readings and periodic reports, maritime data is now entering a new era, driven by the digitalization of onboard equipment, the rise of remote transmission systems, and the development of advanced analytical tools.
Maritime data thus encompasses two major dimensions:
- Onboard data, collected in real time on the vessel using sensors and acquisition systems: fuel consumption, engine speeds, speed over ground and through water, heading, environmental data (swell, wind, current), etc.
- Onshore data, aggregated, processed, and presented in the form of dashboards, reports, and performance indicators accessible to management teams, charterers, and shipowners.
Used intelligently, maritime data does more than just measure: it explains, anticipates, and assists in decision-making.
Why has maritime data
become essential?
An increasingly demanding regulatory framework
The maritime sector is facing an unprecedented regulatory wave. Since January 2023, all vessels over 5,000 gross tonnage are subject to the IMO’s CII (Carbon Intensity Indicator) and EEXI (Energy Efficiency Existing Ship Index): two indicators that require rigorous collection of consumption data and continuous monitoring of each vessel’s carbon intensity.
The goal set by the IMO is clear: reduce the carbon intensity of international shipping by at least 40% by 2030 compared to 2008, and aim for carbon neutrality by around 2050. At the European level, the FuelEU Maritime regulation, which came into force in 2025, imposes a progressive reduction in the intensity of maritime fuel emissions, accompanied by penalties for non-compliance. Vessels calling at European ports are also integrated into the EU Emissions Trading System (EU ETS), which mechanically increases the cost of uncontrolled emissions.
In this context, maritime data is no longer a competitive asset: it is a regulatory obligation and an indispensable compliance tool.
Major economic stakes
Beyond the regulatory framework, economic pressures strongly encourage the intelligent use of data. Fuel represents on average 40% to 60% of a vessel’s operating costs. Every percentage point saved through better knowledge of consumption translates directly into bottom-line gains.
Maritime data makes it possible to identify avoidable expenditure items, optimize navigation speeds, anticipate maintenance needs, and streamline overall fleet management.
A sector in full digital transformation
The maritime industry is not immune to the wave of digitalization sweeping through all industrial sectors. Shipowners, charterers, and fleet operators seek to objectify their decisions, manage remotely and in real time, and report their environmental performance to their clients and partners. Data is the fuel for this transformation.
What type of data is utilized
in maritime data?
The richness of maritime data lies in its diversity. Here are the main categories of data collected and leveraged for vessel or fleet management:
ENERGY CONSUMPTION DATA
Fuel consumption (in liters or tons), instantaneous flow rate, cumulative consumption per navigation phase, consumption/distance ratios… This data is at the heart of calculating regulatory indicators (CII) and energy efficiency analyses.

ENGINE DATA
Speed (RPM), temperature, pressure, operating hours, alerts, and anomalies… Monitoring engine parameters allows for optimizing equipment use and supporting preventive and predictive maintenance strategies.

NAVIGATION DATA
Speed over ground, speed through water, heading, distance traveled, navigation phases (transit, maneuvering, anchoring, quay)… This data allows for reconstructing the vessel’s actual behavior and identifying margins for optimization.

ENVIRONMENTAL DATA
Swell, wind, and current conditions, sea state… By cross-referencing these with consumption data, a complete view of the vessel’s efficiency under real operating conditions is obtained.

POSITION AND TRACEABILITY DATA
Real-time GPS position, route history, port calls, port durations… This data contributes to logistical optimization and regulatory compliance.
EMISSIONS AND CARBON FOOTPRINT DATA
Calculated from consumption data and the emission factors of the fuels used, these support regulatory declarations and environmental reports.
How to effectively leverage maritime data?
Data collection is not enough: it is their processing, qualification, and presentation that create value. Effective utilization of maritime data relies on a complete chain, from acquisition to decision.

1. Reliable and automated acquisition
The first step is to collect reliable raw data continuously, without depending on manual readings prone to error. This involves installing acquisition cards on board connected to the vessel’s equipment, capable of automatically measuring and recording all relevant parameters.

2. Qualification and algorithmic processing
Raw data must be qualified, cleaned, and structured. Modern technologies allow for automatic recognition of navigation phases and contextualization of data (weather conditions, trip type, cargo type, etc.), which is essential for comparing similar situations and drawing relevant conclusions.

3. Real-time onboard visualization
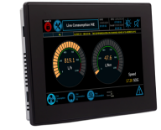
For data to influence the behavior of the seafarer, it must be accessible and readable from the wheelhouse. An onboard visualization screen displaying key indicators (instantaneous consumption, eco-score, alerts) allows the captain and crew to adjust their piloting in real time and benefit from eco-driving recommendations.
4. Onshore analysis and reporting
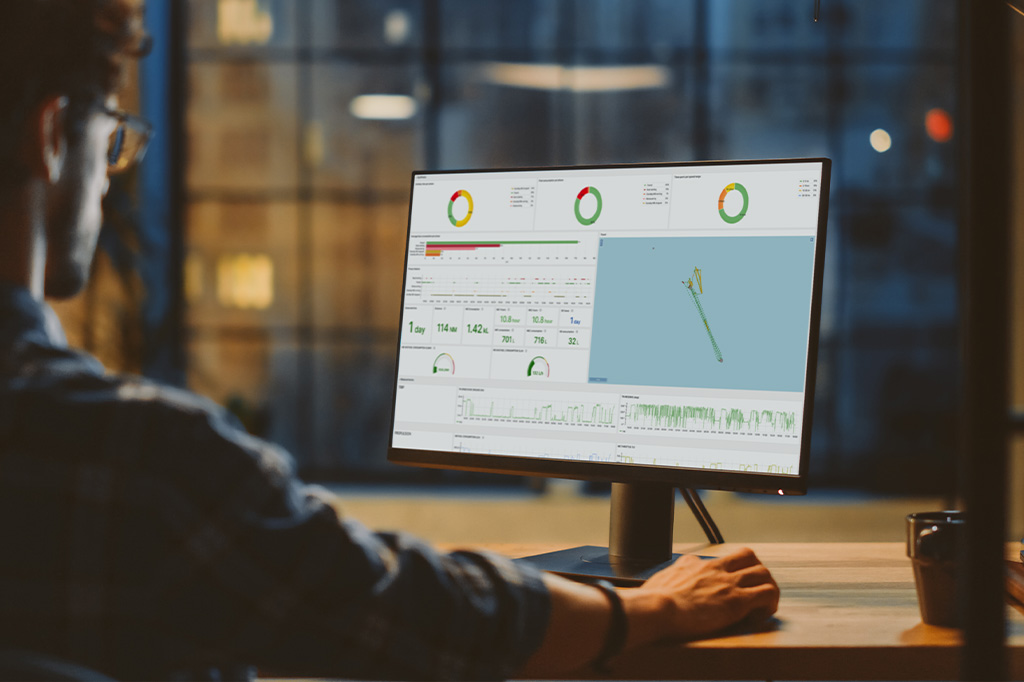
Remote-transmitted data is presented to onshore teams in the form of dashboards and detailed reports. Shipowners, charterers, and fleet managers can thus analyze the performance of each vessel, identify discrepancies, compare behaviors, and manage their strategy in the medium and long term.

5. Strategic decision support
Advanced utilization of maritime data allows for global efficiency diagnostics, prioritizing investments (refit, fleet renewal), meeting regulatory obligations, and defining a documented and credible decarbonization roadmap.

Ecomer Data,
An analytical econometer
for your fleet
A French company specializing in maritime data, Ecomer Data has developed an analytical econometer combining an onboard system and onshore analysis software. Result: a reduction in consumption of up to 10% without vessel modification, facilitated regulatory compliance (CII, EEXI, FuelEU Maritime), and a complete view of your fleet’s performance, at sea and at the quay.
The solution can be installed during new construction or refit, adapts to all types of vessels, and requires no special technical skills from the teams.